- Home
- Actividades
- Ciudadanía Americana
- Comunismo
- Economía
- Estadidad
- Estudios
- "La Gran Potencia Del Caribe" – Bernardo Vázquez
- All Politics Is Local – Tip O'Neill
- Anotaciones Para La Campaña
- Citizenship In The American Empire – Cabranes
- Cómo Ganar Elecciones – Napolitan
- Creación del PNP
- Documentos Históricos de Puerto Rico
- El Arte de la Guerra – Sun Tzu
- El Príncipe de Maquiavelo
- Filosfía Politíca
- Historia de los Partidos Políticos de PR – Bolívar Pagán
- La Retranca del ELA – Dávila Colón
- Los Protocolos De Los Sabios – Parodia Política
- Memorias del Amolao
- On the Nature of War – Clausewitz
- Slogans
- UN MENSAJE A GARCIA
- FashionClothingshirt
- general
- Historia
- No lo Hagan
- Política
- Anotaciones para la Campaña Estadista – Pompy González
- Campaña
- Candidatos
- Comentarios Diarios de Actualidad
- Corupción
- Deportes
- Economía
- Educación
- Izquierdistas
- Justicia
- Links Pro-Americanos
- Mala Administración PPD y Neo-Comunistas
- Municipios y Precintos
- Neo-Comunistas
- PIP
- PIP – Escritos y Noticias
- PNP
- PNP – Escritos y Noticias
- Pobreza
- Política en Latinoamérica
- PPD
- PPD – Escritos y Noticias
- Retiro
- Salud
- Seguridad
- Status
- Trabajo
- Salud
- Seminarios
- Status
- Videos
- Voluntarios Estadistas
- Vídeos
- Indices – Libros y Links Estadistas
- Lucha E51
- UNETE A: @EstadoPRUSA seminarios-pnp.com
- Libros de Estrategia y Campaña Política
- Temas
- Tertuliando
- «Sin Miedo» gritan los Dirigentes Populares que tienen Miedo
- Temas Estadistas Actuales Para Tertulias y Actividades
- Líderes de la Estadidad
- Gobierno publica estados financieros auditados del 2022 y anuncia pasos para regresar a los mercados
- My Calendar
- No debe ocurrir una primaria Novo progresista – Por Dr. José M. Saldana
- Defendiendo la Rectora de la Escuela de Medicina – O Separatistas la Destruyen
- Cuatro libros indispensables – Por Mario Ramos Méndez – Historiador
- Pierluisi y el Desarrollo Económico Logrado Mejor Que muchas Décadas
- Sobre las candidaturas de agua – Por Iván Rivera
- El nacimiento e influencias revolucionarias del Movimiento Pro-Independencia de Puerto Rico – Por Mario Ramos Méndez
- La corrupción que no tiene fin – Por Mario Ramos Méndez
- Realidad Colonial: Lucha entre Biden y Trump – Por Dr. José M. Saldaña
- La isla de los piratas – PorMario Ramos Méndez, Historiador
- Ya es hora de actuar localmente pues Trump continúa prevaleciendo en las primarias – Por Dr. Jos’e M. Saldaña
- Pedro Pierluisi Incansable por Puerto Rico
- Si los Americanos nos Hacen Iguales es la Mejor Independencia – De Diego
- Muñoz y el sueño derrotado – Por Mario Ramos Méndez
- ¿Que es la estadidad? – Jerry Acosta
- Estadistas Ganan Posiciones en Votaciones Partido Demócrata – marzo 2024
- Los Separatistas Comunistoides
- La nueva secretaria de Educación – Por Mario Ramos
- La Próxima Y Severa Crisis Por Venir! – Minoria de Uno
- LA CUARTA REVOLUCION INDUSTRIAL Y SUS EFECTOS!
- Página Pedro Pierluisi y Para el Voto Ausente y Adelantado
- Santa Cló como tradición puertorriqueña – Mario Ramos Méndez 22/12/2023
- No El voto extranjero en el P. de la C. 1891 – Por Andrés L. Córdova
- Pierluisi y el Desarrollo Económico Logrado Mejor Que muchas Décadas
- La Estadidad para Puerto Rico más Cerca que Nunca
- #82558 (sin título)
- Comparación Económica Estados y Puerto Rico – 2020
- Para el PN P Ganar Cada Municipio
- Programa Federal Instalar Paneles Solares
- ¿Somos viables como pueblo?
- La decisión del gobernador sobre LUMA
- Convocan a manifestaciones en contra de la estadidad y a favor de la descolonización Publicado el junio 20, 2021 por estado51prusa
- Puerto Rico’s ‘Tax Haven’ Isn’t Causing Inequality, Its Territorial Status Is
- SILA Calderón opinando – Por José M. Saldaña
- PNP le contesta al PIP: “tenemos mandato del Pueblo”
- ¿Que es la estadidad? – Jerry Acosta
- Nacionalismo? Por Mario Ramos
- 2019 Presidential candidates discovering Puerto Rico – Por Kenneth McClintock
- La Realidad Cubana que Victoria Ciudadana Aspira
- Amplio Respaldo USA a la Estadidad para ZpR
- El vínculo indisoluble de la ciudadanía americana
- Estado51PRUSA-Blog
- “Tienen una carga importante de trabajo”, dice Pierluisi sobre la nómina de confianza del DE
- Sobre la Asamblea Demócrata, las Primarias del PNP y el 2024!
- Integrarán más personas con diversidad funcional en el gobierno
- Pierluisi: «Por cada Crítica Hay Cientos de Obras»
- Solicitudes de voto adelantado ya están disponibles en el PNP
- Una agenda ideológica – Por Mario Ramos Méndez
- Pierluisi afirma que «este no es el momento» para convocar un plebiscito de estatus
- Trump criticizes Biden’s treatment of Puerto Rico – The San Juan Star
- Amigo de JGo dice que fue «inducida a error» al aspirar por la gobernación
- SALIDA SUMARIA DE LA MARINA DE PUERTO RICO
- NO TE DEJES CONFUNDIR DILE NO A LA NACIÓN VIRTUAL
- Oreste Ramos Lee la columna de opinión de Mario Ramos Méndez
- La agresora corrupción – Lee la columna de opinión de Mario Ramos Méndez aquí
- Los estadistas independientes – Por Mario Ramos Méndez
- Pro-statehood lawyer: Effort to repeal ‘Insular Cases’ may be misdirected
- Contáctanos
Cidre dijo en WUNO 630 q están llegando muchos inversionistas – En Europa y USA al Unirse Países/Territorios aumentó su Economía 8-10 veces – Alaska Hawaii
List of U.S. states by income – Wikipedia
States ranked by median household income
| Rank | State | 2014 | 2010 | 2009 | 2007 | 2000 |
|---|---|---|---|---|---|---|
| 1 | Maryland | $70,004 | $69,272 | $70,545 | $87,080 | $72,372 |
| 2 | New Jersey | $69,825 | $68,342 | $70,378 | $84,035 | $70,169 |
| 3 | California | $67,458 | $67,034 | $71,595 | $90,967 | $81,972 |
| 4 | Connecticut | $65,753 | $66,953 | $68,460 | $81,333 | $67,639 |
| District of Columbia | $65,124 | $63,098 | $57,214 | $52,746 | $50,681 | |
| 5 | Massachusetts | $64,859 | $62,081 | $61,401 | $59,365 | $56,236 |
| 6 | New Hampshire | $64,712 | $63,557 | $62,731 | $61,369 | $60,489 |
| 7 | Virginia | $62,881 | $61,330 | $58,233 | $59,562 | $55,108 |
| 8 | Hawaii | $62,814 | $59,290 | $57,936 | $97,317 | –[1] |
| 9 | Minnesota | $61,814 | $58,931 | $57,021 | $59,948 | $53,770 |
| 10 | Alaska | $60,287 | $69,860 | $79,989 | $95,470 | $90,214 |
| 11 | Delaware | $57,954 | $58,548 | $60,078 | $85,591 | $73,439 |
| 12 | Washington | $57,835 | $54,616 | $52,288 | $50,082 | $50,011 |
| 13 | Wyoming | $56,322 | $55,430 | $56,993 | $55,212 | $54,039 |
| 14 | Utah | $55,869 | $55,117 | $56,633 | $55,109 | $55,179 |
| 15 | Colorado | $55,387 | $54,659 | $56,033 | $53,514 | $48,201 |
| 16 | New York | $55,246 | $54,119 | $55,701 | $53,914 | $52,003 |
| 17 | Rhode Island | $53,636 | $53,966 | $56,235 | $54,124 | $49,280 |
| 18 | Illinois | $53,234 | $53,341 | $56,361 | $55,062 | $50,819 |
| 19 | Vermont | $52,776 | $52,664 | $53,207 | $51,731 | $47,227 |
| 20 | North Dakota | $51,704 | $51,618 | $52,104 | $49,907 | $51,622 |
| United States | $50,502 | $50,221 | $52,029 | $50,740 | –[2] | |
| 21 | Wisconsin | $50,395 | $49,993 | $52,094 | $50,578 | $48,874 |
| 22 | Nebraska | $50,296 | $49,520 | $50,713 | $48,576 | $47,791 |
| 23 | Pennsylvania | $50,228 | $48,745 | $50,958 | $49,889 | $46,729 |
| 24 | Iowa | $49,427 | $48,457 | $50,169 | $48,730 | $45,485 |
| 25 | Texas | $49,392 | $48,259 | $50,043 | $47,548 | $43,425 |
| 26 | Kansas | $48,964 | $48,044 | $48,980 | $47,292 | $47,489 |
| 27 | Nevada | $48,927 | $47,827 | $45,685 | $43,753 | $43,753 |
| 28 | South Dakota | $48,321 | $47,817 | $50,177 | $47,451 | $44,264 |
| 29 | Oregon | $46,816 | $47,590 | $50,861 | $49,136 | $46,841 |
| 30 | Arizona | $46,709 | $47,357 | $49,693 | $47,085 | $48,126 |
| 31 | Indiana | $46,438 | $45,734 | $46,581 | $45,888 | $45,040 |
| 32 | Maine | $46,033 | $45,424 | $47,966 | $47,448 | $44,806 |
| 33 | Georgia | $46,007 | $45,395 | $47,988 | $46,597 | $45,837 |
| 34 | Michigan | $45,981 | $45,255 | $48,591 | $47,950 | $47,064 |
| 35 | Ohio | $45,749 | $45,229 | $46,867 | $45,114 | $44,651 |
| 36 | Missouri | $45,247 | $45,043 | $46,032 | $43,424 | $44,624 |
| 37 | Florida | $44,299 | $44,926 | $47,576 | $46,253 | $46,395 |
| 38 | Montana | $44,222 | $44,736 | $47,778 | $47,804 | $44,448 |
| 39 | North Carolina | $43,916 | $43,674 | $46,549 | $44,670 | $42,061 |
| 40 | Idaho | $43,341 | $43,028 | $43,508 | $41,452 | $40,827 |
| 41 | Oklahoma | $43,225 | $42,492 | $43,733 | $40,926 | $37,943 |
| 42 | South Carolina | $42,367 | $42,442 | $44,625 | $43,329 | $40,822 |
| 43 | New Mexico | $41,963 | $42,322 | $43,654 | $43,531 | $38,629 |
| 44 | Louisiana | $41,734 | $41,725 | $43,614 | $42,367 | $40,676 |
| 45 | Tennessee | $41,693 | $41,664 | $42,822 | $41,567 | $40,001 |
| 46 | Alabama | $41,415 | $40,489 | $42,666 | $40,554 | $38,473 |
| 47 | Kentucky | $41,141 | $40,072 | $41,538 | $40,267 | $38,466 |
| Guam | $38,973 | – | – | – | – | |
| 48 | Arkansas | $38,758 | $37,823 | $38,815 | $38,134 | $37,420 |
| 49 | West Virginia | $38,482 | $37,435 | $37,989 | $37,060 | $37,227 |
| 50 | Mississippi | $36,919 | $36,646 | $37,790 | $36,338 | $35,261 |
| U.S. Virgin Islands | $30,921 | – | – | – | – | |
| Northern Mariana Islands | $23,171 | – | – | – | – | |
| Puerto Rico | $23,168 | – | – | – | – | |
| American Samoa | – | $34,254[3] | – | – | $17,018[4] |
Median Household Income by State [5] [6] [7][8] [9] [10][11] [12]
States ranked by per capita income
All data is from the 2010-2014 American Community Survey 1-Year Estimates.[5][6]
| Rank | State | Per capita income |
Median household income |
Median family income |
Population | Number of households |
Number of families |
|---|---|---|---|---|---|---|---|
| District of Columbia | $45,877 | $71,648 | $84,094 | 658,893 | 277,378 | 117,864 | |
| 1 | Connecticut | $39,373 | $70,048 | $88,819 | 3,596,677 | 1,355,817 | 887,263 |
| 2 | New Jersey | $37,288 | $69,160 | $87,951 | 8,938,175 | 2,549,336 | 1,610,581 |
| 3 | Massachusetts | $36,593 | $71,919 | $88,419 | 6,938,608 | 3,194,844 | 2,203,675 |
| 4 | Maryland | $36,338 | $73,971 | $89,678 | 5,976,407 | 2,165,438 | 1,445,972 |
| 5 | New Hampshire | $34,691 | $66,532 | $80,581 | 1,326,813 | 519,756 | 345,901 |
| 6 | Virginia | $34,052 | $64,902 | $78,290 | 8,326,289 | 3,083,820 | 2,058,820 |
| 7 | New York | $33,095 | $58,878 | $71,115 | 19,746,227 | 7,282,398 | 4,621,954 |
| 8 | North Dakota | $33,071 | $59,029 | $75,221 | 739,482 | 305,431 | 187,800 |
| 9 | Alaska | $33,062 | $71,583 | $82,307 | 736,732 | 249,659 | 165,015 |
| 10 | Minnesota | $32,638 | $61,481 | $77,941 | 5,457,173 | 2,129,195 | 1,369,594 |
| 11 | Colorado | $32,357 | $61,303 | $75,405 | 5,355,866 | 2,039,592 | 1,315,283 |
| 12 | Washington | $31,841 | $61,366 | $74,193 | 7,061,530 | 2,679,601 | 1,725,099 |
| 13 | Rhode Island | $30,830 | $54,891 | $71,212 | 1,055,173 | 409,654 | 257,165 |
| 14 | Delaware | $30,488 | $59,716 | $72,594 | 935,614 | 349,743 | 233,000 |
| 15 | California | $30,441 | $61,933 | $71,015 | 38,802,500 | 12,758,648 | 8,762,059 |
| 16 | Illinois | $30,417 | $57,444 | $71,796 | 12,880,580 | 4,772,421 | 3,099,184 |
| 17 | Hawaii | $29,736 | $69,592 | $79,187 | 1,419,561 | 450,769 | 314,151 |
| 18 | Wyoming | $29,698 | $57,055 | $72,460 | 584,153 | 232,594 | 149,032 |
| 19 | Pennsylvania | $29,220 | $53,234 | $67,876 | 12,787,209 | 4,945,972 | 3,185,054 |
| 20 | Vermont | $29,178 | $54,166 | $67,154 | 626,562 | 257,229 | 162,017 |
| United States | $28,889 | $53,657 | $65,910 | 318,857,056 | 117,259,427 | 77,152,072 | |
| 21 | Iowa | $28,361 | $53,712 | $67,771 | 3,107,126 | 1,241,471 | 801,562 |
| 22 | Wisconsin | $28,213 | $52,622 | $67,187 | 5,757,564 | 2,307,685 | 1,485,877 |
| 23 | Maine | $27,978 | $49,462 | $62,078 | 1,330,089 | 549,841 | 344,585 |
| 24 | Kansas | $27,870 | $52,504 | $66,425 | 2,904,021 | 1,109,280 | 728,602 |
| 25 | Oregon | $27,646 | $51,075 | $62,670 | 3,970,239 | 1,535,511 | 966,250 |
| 26 | Nebraska | $27,446 | $52,686 | $66,120 | 1,881,503 | 740,765 | 480,317 |
| 27 | Texas | $27,125 | $53,035 | $62,830 | 26,956,958 | 9,277,197 | 6,407,165 |
| 28 | South Dakota | $26,959 | $50,979 | $66,936 | 853,175 | 334,475 | 211,235 |
| 29 | Ohio | $26,937 | $49,308 | $62,300 | 11,594,163 | 4,593,172 | 2,923,523 |
| 30 | Michigan | $26,613 | $49,847 | $62,143 | 9,909,877 | 3,834,574 | 2,485,159 |
| 31 | Florida | $26,582 | $47,463 | $57,212 | 19,893,297 | 7,328,046 | 4,693,411 |
| 32 | Missouri | $26,126 | $48,363 | $61,299 | 6,063,589 | 2,354,809 | 1,508,816 |
| 33 | Montana | $25,989 | $46,328 | $60,643 | 1,023,579 | 410,962 | 251,176 |
| 34 | North Carolina | $25,774 | $46,556 | $57,380 | 9,943,964 | 3,790,620 | 2,492,048 |
| 35 | Nevada | $25,773 | $51,450 | $60,824 | 2,839,099 | 1,021,519 | 642,461 |
| 36 | Arizona | $25,715 | $50,068 | $59,700 | 6,731,484 | 2,428,743 | 1,579,481 |
| 37 | Georgia | $25,615 | $49,321 | $58,885 | 10,097,343 | 3,587,521 | 2,426,392 |
| 38 | Oklahoma | $25,229 | $47,529 | $58,710 | 3,878,051 | 1,459,759 | 966,516 |
| 39 | Indiana | $25,140 | $49,446 | $60,780 | 6,596,855 | 2,502,739 | 1,657,223 |
| 40 | Tennessee | $24,922 | $44,361 | $55,557 | 6,549,352 | 2,509,665 | 1,660,344 |
| 41 | Utah | $24,877 | $60,922 | $69,535 | 2,942,902 | 918,370 | 691,495 |
| 42 | Louisiana | $24,800 | $44,555 | $56,573 | 4,649,676 | 1,718,194 | 1,112,659 |
| 43 | South Carolina | $24,596 | $45,238 | $56,491 | 4,832,482 | 1,826,914 | 1,201,616 |
| 44 | Idaho | $23,938 | $47,861 | $58,101 | 1,634,464 | 591,587 | 407,499 |
| 45 | Kentucky | $23,684 | $42,958 | $54,776 | 4,413,457 | 1,712,094 | 1,124,586 |
| 46 | New Mexico | $23,683 | $44,803 | $54,705 | 2,085,572 | 760,916 | 489,532 |
| 47 | Alabama | $23,606 | $42,830 | $53,764 | 4,849,377 | 1,841,217 | 1,232,515 |
| 48 | Arkansas | $22,883 | $41,262 | $51,528 | 2,966,369 | 1,131,288 | 752,212 |
| 49 | West Virginia | $22,714 | $41,059 | $52,413 | 1,850,326 | 735,375 | 472,869 |
| 50 | Mississippi | $21,036 | $39,680 | $50,178 | 2,994,079 | 1,095,823 | 738,463 |
| Puerto Rico | $11,241 | $18,928 | $22,477 | 3,548,397 | 1,233,490 | 867,505 |
Income statistics[edit]
In the United States the most widely cited personal income statistics are the Bureau of Economic Analysis‘s personal income and the Census Bureau‘s per capita money income. The two statistics spring from different traditions of measurement—personal income from national economic accounts and money income from household surveys. BEA’s statistics relate personal income to measures of production, including GDP, and is considered an indicator of consumer spending. The Census Bureau’s statistics provide detail on income distribution and demographics and are used to produce the nation’s official poverty statistics.
Personal income and disposable personal income[edit]
BEA’s personal income measures the income received by persons from participation in production, from government and business transfers, and from holding interest-bearing securities and corporate stocks. Personal income also includes income received by nonprofit institutions serving households, by private non-insured welfare funds, and by private trust funds. BEA also publishes disposable personal income, which measures the income available to households after paying federal and state and local government income taxes.
Income from production is generated both by the labor of individuals (for example, in the form of wages and salaries and of proprietors’ income) and by the capital that they own (in the form of rental income of persons). Income that is not earned from production in the current period—such as capital gains, which relate to changes in the price of assets over time—is excluded.
BEA’s monthly personal income estimates are one of several key macroeconomic indicators that the National Bureau of Economic Research considers when dating the business cycle.
Personal income and disposable personal income are provided both as aggregate and as per capita statistics. BEA produces monthly estimates of personal income for the nation, quarterly estimates of state personal income, and annual estimates of local-area personal income. More information is found on BEA’s website.
Census Money Income[edit]
The Census Bureau collects income data on several major surveys, including the Annual Social and Economic Supplement (ASEC) of the Current Population Survey (CPS), the Survey of Income and Program Participation (SIPP), and the American Community Survey (ACS). The CPS is the source of the official national estimates of poverty and the most widely cited source of annual household income estimates for the United States.[7]
The CPS measure of money income is defined as the total pre-tax cash income received by people on a regular basis, excluding certain lump-sum payments and excluding capital gains.
The Census Bureau also produces alternative estimates of income and poverty based on broadened definitions of income that include many of these income components that are not included in money income.
The Census Bureau releases estimates of household money income as medians, percent distributions by income categories, and on a per capita basis. Estimates are available by demographic characteristics of householders and by the composition of households. More details on income concepts and sources are found on the Census Bureau’s website.
By educational attainment[edit]

| Measure | Some High School | High school graduate | Some college | Associate’s degree | Bachelor’s degree or higher | Bachelor’s degree | Master’s degree | Professional degree | Doctorate degree |
|---|---|---|---|---|---|---|---|---|---|
| Persons, age 25+ w/ earnings | $17,116 | $25,785 | $30,932 | $35,072 | $55,071 | $49,804 | $61,655 | $91,538 | $79,231 |
| Male, age 25+ w/ earnings | $22,214 | $32,307 | $39,823 | $43,785 | $70,437 | $62,304 | $78,222 | $111,881 | $91,604 |
| Female, age 25+ w/ earnings | $12,768 | $19,810 | $24,512 | $28,664 | $45,170 | $40,115 | $51,494 | $65,012 | $68,887 |
| Persons, age 25+, employed full-time | $30,598 | $38,102 | $43,377 | $47,401 | $71,221 | $64,074 | $77,285 | $117,679 | $101,307 |
Income distribution[edit]
Of those individuals with income who were older than 15 years of age, approximately 50% had incomes below $30,000 while the top 10% had incomes exceeding $95,000 a year in 2015.[2] The distribution of income among individuals differs substantially from household incomes as 39% of all households had two or more income earners. As a result, 25% of households have incomes above $100,000,[8] even though only 9.2% of Americans had incomes exceeding $100,000 in 2010.[2]
As a reference point, the US minimum wage since 2009 has been $7.25 per hour or $15,080 for the 2080 hours in a typical work year. The minimum wage is approximately 25% over the official U.S. government-designated poverty income level for a single person unit (before taxes) and about 63% of the designated poverty level for a family of four, assuming only one worker (before taxes). (See Poverty in the United States). Annual wages of $30,160; $45,240; $75,400; $150,800 and $1.5M correspond to 2, 3, 5, 10 and 100 times minimum wage respectively.[9]

| Income range | Number of individuals | Percent in group | Percent at or below | Cumulative percentages | ||
|---|---|---|---|---|---|---|
| Under $2,500 | 14,689,000 | 6.48 | 6.48 | less than $25k 42.87% |
less than $50k 70.23% |
less than $100k 90.85% |
| $2,500 to $4,999 | 6,262,000 | 2.76 | 9.24 | |||
| $5,000 to $7,499 | 7,657,000 | 3.38 | 12.62 | |||
| $7,500 to $9,999 | 10,551,000 | 4.65 | 17.27 | |||
| $10,000 to $12,499 | 12,474,000 | 5.50 | 22.77 | |||
| $12,500 to $14,999 | 8,995,000 | 3.97 | 26.74 | |||
| $15,000 to $17,499 | 10,672,000 | 4.71 | 31.44 | |||
| $17,500 to $19,999 | 7,931,000 | 3.50 | 34.94 | |||
| $20,000 to $22,499 | 11,301,000 | 4.86 | 39.80 | |||
| $22,500 to $24,999 | 6,962,000 | 3.07 | 42.87 | |||
| $25,000 to $50,000 | ||||||
| $25,000 to $27,499 | 9,623,000 | 4.24 | 47.12 | $25k–$50k 27.36% |
||
| $27,500 to $29,999 | 5,535,000 | 2.44 | 49.56 | |||
| $30,000 to $32,499 | 10,399,000 | 4.59 | 54.15 | |||
| $32,500 to $34,999 | 4,429,000 | 1.95 | 56.10 | |||
| $35,000 to $37,499 | 7,975,000 | 3.52 | 59.62 | |||
| $37,500 to $39,999 | 3,930,000 | 1.73 | 61.35 | |||
| $40,000 to $42,499 | 8,091,000 | 3.57 | 64.92 | |||
| $42,500 to $44,999 | 3,113,000 | 1.37 | 66.29 | |||
| $45,000 to $47,499 | 5,718,000 | 2.52 | 68.81 | |||
| $47,500 to $49,999 | 3,221,000 | 1.42 | 70.23 | |||
| $50,000 to $75,000 | ||||||
| $50,000 to $52,499 | 7,130,000 | 3.14 | 73.38 | $50k–$75k 14.06% |
$50k–$100k 20.62% |
|
| $52,500 to $54,999 | 2,489,000 | 1.10 | 74.47 | |||
| $55,000 to $57,499 | 3,834,000 | 1.69 | 76.16 | |||
| $57,500 to $59,999 | 2,066,000 | 0.91 | 77.08 | |||
| $60,000 to $62,499 | 5,047,000 | 2.23 | 79.30 | |||
| $62,500 to $64,999 | 1,894,000 | 0.84 | 80.14 | |||
| $65,000 to $67,499 | 3,289,000 | 1.45 | 81.59 | |||
| $67,500 to $69,999 | 1,493,000 | 0.66 | 82.24 | |||
| $70,000 to $72,499 | 3,264,000 | 1.44 | 83.68 | |||
| $72,500 to $74,999 | 1,372,000 | 0.61 | 84.29 | |||
| $75,000 to $100,000 | ||||||
| $75,000 to $77,499 | 2,922,000 | 1.29 | 85.58 | $75k–$100k 6.56% |
||
| $77,500 to $79,999 | 1,307,000 | 0.58 | 86.15 | |||
| $80,000 to $82,499 | 2,725,000 | 1.20 | 87.36 | |||
| $82,500 to $84,999 | 1,021,000 | 0.45 | 87.81 | |||
| $85,000 to $87,499 | 1,508,000 | 0.67 | 88.47 | |||
| $87,500 to $89,999 | 856,000 | 0.38 | 88.85 | |||
| $90,000 to $92,499 | 1,966,000 | 0.87 | 89.72 | |||
| $92,500 to $94,999 | 712,000 | 0.31 | 90.03 | |||
| $95,000 to $97,499 | 1,090,000 | 0.48 | 90.51 | |||
| $97,500 to $99,999 | 768,000 | 0.34 | 90.85 | |||
| $100,000 or more | ||||||
| $100,000 or more | 20,755,000 | 9.15 | 100 | 9.15% | ||
SOURCE: US Census Bureau, Current Population Survey 2016[2]
Over time, by ethnicity and sex[edit]
|
|
This section needs to be updated. (October 2013) |
This chart is median income of 15 year olds or older, who have non-zero income.[12] Amounts are shown in nominal dollars and in real dollars in parentheses, 2004 dollars.
| 1950 | 1960 | 1970 | 1980 | 1990 | 2000 | 2004 | ||
|---|---|---|---|---|---|---|---|---|
| Overall | Male | $2,570 ($17,076) | $4,080 ($22,051) | $6,670 ($28,100) | $12,530 ($27,206) | $20,293 ($28,439) | $28,343 ($31,089) | $30,513 |
| Female | $953 ($6,333) | $1,261 ($6,815) | $2,237 ($9,424) | $4,920 ($10,683) | $10,070 ($14,112) | $16,063 ($17,619) | $17,629 | |
| White/European American | Male | $2,709 ($18,001) | $4,296 ($23,219) | $7,011 ($30,536) | $13,328 ($28,939) | $21,170 ($29,668) | $29,797 ($32,684) | $31,335 |
| Female | $1,060 ($7,044) | $1,352 ($7,307) | $2,266 ($9,546) | $4,947 ($10,741) | $10,317 ($14,459) | $16,079 ($17,637) | $17,648 | |
| Black/African American | Male | $1,471 ($9,775) | $2,260 ($12,215) | $4,157 ($17,513) | $8,009 ($17,390) | $12,868 ($18,034) | $21,343 ($23,411) | $22,740 |
| Female | $474 ($3,150) | $837 ($4,524) | $2,063 ($8,691) | $4,580 ($9,944) | $8,328 ($11,671) | $15,581 ($17,420) | $18,379 | |
| Asian | Male | NA | NA | NA | NA | $19,394 ($27,179) | $30,833 ($33,820) | $32,419 |
| Female | NA | NA | NA | NA | $11,086 ($15,536) | $17,356 ($19,038) | $20,618 |
By ethnicity and origin[edit]

|
|
This section needs to be updated. (October 2013) |
Personal income varied significantly with an individual’s racial characteristics with racial discrepancies having remained largely stagnant since 1996. Overall, Asian Americans enjoyed higher median personal incomes than any other racial demographic. Asian Americans had a median income roughly ten percent higher than that of Whites.[13] The only exception was among the holders of graduate degrees who constitute 8.9% of the population. Among those with a Master’s, Professional or Doctorate degree those who identified as White had the highest median individual income. This racial income gap was relatively small.[13][14]
Those identifying as Hispanic or Latino (who may have been of any «race») had the lowest overall median personal income, earning 28.51% less than Whites[14][15] and 35% less than Asian Americans.[13] The second largest racial or ethnic gap was between Whites and African Americans with the former earning roughly 22% more than the latter. Thus one can observe a significant discrepancy with the median income of Asians and Whites and that of African Americans and Hispanics.[16]
Overall the race gap between African Americans and Whites has remained roughly equal between both races over the past decade.[14][17] Both races saw a gain in median income between 1996 and 2006, with the income growth among African Americans slightly outpacing that of Whites. In 1996 the median income for Whites was $5,957 (31%) higher than for Blacks. In 2006 the gap in median incomes was nearly identical with the median income for Whites being $5,929 (22%) higher than that for African Americans. While the gap remains numerically unchanged, the percentage difference between the two races has decreased as a result of mutual increases in median personal income.[14][17]
Measuring income by per capita is another way to look at personal earnings by race. Unlike median statistics, per capita statistics are affected by extremely high and low incomes. According to the U.S Census Bureau «The per capita income for the overall population in 2008 was $26,964; for non-Hispanic Whites, it was $31,313; for Blacks, it was $18,406; for Asians, it was $30,292; and for Hispanics, it was $15,674.»[18]
-
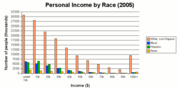
The number of thousands of individuals in each income bracket.
-
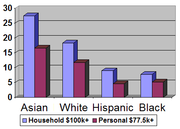
Percent of households with six figure incomes and individuals with incomes in the top 10%, exceeding $77,500.
-
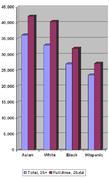
Median personal income by race(note:can be misleading, since «Hispanics» includes people of all racial categories).[19]


| Race | Overall Median | High School | Some College | College Graduate | Bachelor’s Degree | Master’s Degree | Doctorate Degree | |
|---|---|---|---|---|---|---|---|---|
| Total population | All, age 25+ | 32,140 | 26,505 | 31,054 | 49,303 | 43,143 | 52,390 | 70,853 |
| Full-time workers, age 25-64 | 39,509 | 31,610 | 37,150 | 56,027 | 50,959 | 61,324 | 79,292 | |
| White alone | All, age 25+ | 33,030 | 27,311 | 31,564 | 49,972 | 43,833 | 52,318 | 85,658 |
| Full-time workers, age 25-64 | 40,422 | 32,427 | 38,481 | 56,903 | 51,543 | 61,441 | 77,906 | |
| Asian alone | All, age 25+ | 36,152 | 25,285 | 29,982 | 51,481 | 42,466 | 61,452 | 69,653 |
| Full-time workers, age 25-64 | 42,109 | 27,041 | 33,120 | 60,532 | 51,040 | 71,316 | 91,430 | |
| African American | All, age 25+ | 27,101 | 22,379 | 27,648 | 44,534 | 41,572 | 48,266 | 61,894 |
| Full-time workers, age 25-64 | 32,021 | 26,230 | 32,392 | 47,758 | 45,505 | 52,858 | 73,265 | |
| Hispanic or Latino (of any race) | All, age 25+ | 23,613 | 22,941 | 28,698 | 41,596 | 37,819 | 50,901 | 67,274 |
| Full-time workers, age 25-64 | 27,266 | 26,461 | 33,120 | 46,594 | 41,831 | 53,880 | N/A | |
Source: US Census Bureau, 2006[19]
Para trabajar por la Estadidad:
http://estado51prusa.com
Seminarios-pnp.com
https://twitter.com/EstadoPRUSA
https://www.facebook.com/EstadoPRUSA/


You must be logged in to post a comment Login